
Highlights
- 5Y Total Shareholder Return (TSR) 8.8% p.a.Ω
- US$4.8bn in capital recycled# across the Group in 2025 and US$2.8bn re-invested in portfolio as capital expenditure in the portfolio
- JMH parent free cash flow^ up 7% to US$933m
- Full year dividend 4% higher at US$2.35 per share
- Underlying net profit* 11% higher at US$1.68bn. Underlying EPS US$5.72, up 9%
- Reported net profit§ at US$1.11bn, up US$1.58bn from the prior year. JMH parent company balance sheet net cash positive
- Privatisation of Mandarin Oriental completed in January 2026
2025 financial highlights
5YR total shareholder return (%)
0%
Group capital recycling# (US$bn)
US$0bn
JMH parent company net cash/(borrowings)
(US$bn)
US$0m
Underlying net profit & Parent free cash flow
(US$m)
US$0m & US$0m
Underlying EPS (US$)
US$0
DPS (US$)
US$0
Results summary
|
2025
|
2024
|
Change (%)
|
|
|---|---|---|---|
|
5Y TSR (% per annum)
|
8.8%
|
-0.6%
|
9.4ppts
|
|
Capital recycled# across the Group (US$m)
|
4,777
|
946
|
+405
|
|
Capital invested across the Group (US$m)
|
(2,801)
|
(2,397)
|
+17
|
|
JMH parent free cash flow^ (US$m)
|
933
|
875
|
+7
|
|
Full year dividend per share (US$)
|
2.35
|
2.25
|
+4
|
|
Underlying profit* attributable to shareholders (US$m)
|
1,681
|
1,518
|
+11
|
|
JMH parent net cash/(borrowings) (US$m)
|
41
|
(1,312)
|
N/A
|
|
Underlying earnings* per share (US$)
|
5.72
|
5.24
|
+9
|
|
Revenue (US$m)
|
34,217
|
35,779
|
-4
|
|
Profit/(loss) attributable to shareholders (US$m)
|
1,109
|
(468)
|
N/A
|
|
Earnings/(loss) per share (US$)
|
3.78
|
(1.61)
|
N/A
|
|
Shareholders’ funds (US$m)
|
29,033
|
27,880
|
+4
|
ΩTSR quoted are % p.a. figures, unless otherwise stated.
#Capital recycling is described on page 15 of the Annual Report.
^Recurring dividend income less corporate costs and net financing charges.
*The Group uses ‘underlying net profit’, which refers to underlying profit attributable to shareholders, in its internal financial reporting to distinguish between core business performance and non-trading items. Management considers this to be a key measure which provides greater understanding of the Group’s underlying business performance of core business. The comparative figures have been re-presented to include the profit or loss from non-strategic business in non-trading items, as more fully described in Notes 1 and 41 to the financial statements.
§Represented profit attributable to shareholders.
Performance
Total shareholder return (%)
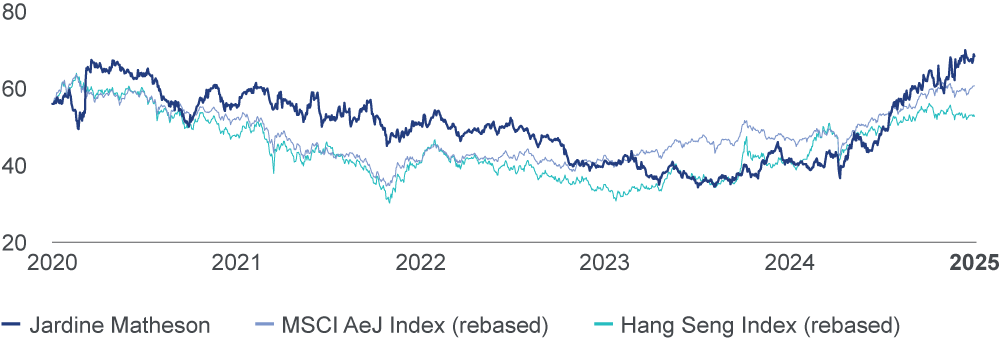
Stock price performance
Portfolio mix (Underlying net profit breakdown)
By business
Astra
Hongkong Land
DFI Retail
Jardine Pacific
JC&C (excl. Astra)
Zhongsheng
Mandarin Oriental
Note: % excludes Corporate and other interests
By sector
Engineering, heavy equipment, mining and construction
Motor vehicles
Property
Retail and restaurants
Financial services
Hotels
Others
Note: % excludes Corporate and other interests
By geography
Indonesia
Hong Kong & Macau
Other Southeast Asia
Vietnam
Rest of the world
Chinese mainland
Note: % excludes Corporate and other interests
Sustainability
|
Rating agency
|
Ranking
|
Jardines ESG performance
|
|---|---|---|
|
S&P Global (CSA)
|
54
|
Ranked in the 82nd percentile, well above the industry average for industrial conglomerates (36).
|
|
ISS ESG
|
Prime
|
Prime status is awarded to companies with ESG performance above the sector-specific Prime threshold, indicating strong absolute ESG performance.
|
ΩTSR quoted are % p.a. figures, unless otherwise stated.
#Capital recycling is described on page 15 of the Annual Report
^Recurring dividend income less corporate costs and net financing charges.
*The Group uses ‘underlying net profit’, which refers to underlying profit attributable to shareholders, in its internal financial reporting to distinguish between core business performance and non-trading items. Management considers this to be a key measure which provides greater understanding of the Group’s underlying business performance of core business. The comparative figures have been re-presented to include the profit or loss from non-strategic business in non-trading items, as more fully described in Notes 1 and 41 to the financial statements.
§Represented profit attributable to shareholders.